Market Volatility
Vancouver experiences a 12% higher seasonal price surge compared to the national average, primarily driven by logistics and local demand density.
Retail Cycles GuideA technical breakdown of seasonal inflation, retail cycles, and logistical expenses in the Lower Mainland. Learn how to navigate the 18.4% average increase in holiday overhead through data-driven planning.
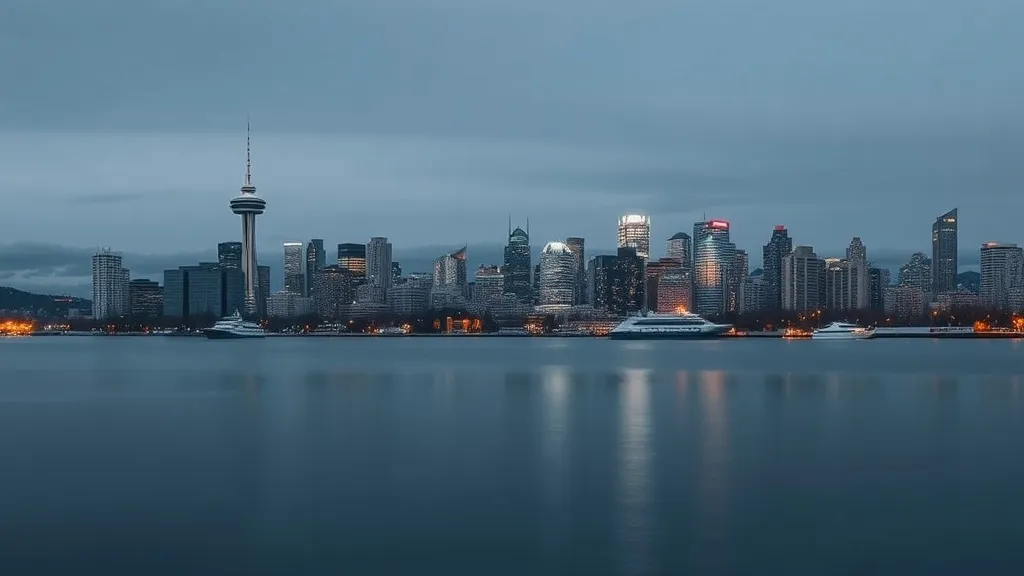
Vancouver experiences a 12% higher seasonal price surge compared to the national average, primarily driven by logistics and local demand density.
Retail Cycles GuideLast-mile delivery and transportation costs peak between November 15 and December 24, requiring a 15% buffer in all shipping budgets.
Debt ManagementPort congestion and regional supply chain constraints lead to an average 22% markup on imported specialty holiday goods in the Metro area.
Case StudiesAnalyzing the Vancouver market requires a granular look at the consumer price index (CPI) specifically during the Q4 window. Historical data suggests that the "Holiday Premium" in British Columbia is influenced heavily by the carbon tax impacts on heating and transport, alongside the standard retail markup. In the Lower Mainland, residents often face a dual-pressure system where housing costs limit discretionary spending, yet social expectations for the festive season remain high. This creates a financial friction point that can only be mitigated through advanced capital allocation.
Our research indicates that the average Vancouver household spends approximately $1,200 more in December than in any other month. This figure includes gift procurement, increased utility consumption, and social obligations. By tracking the retail seasonal cycles, consumers can identify specific windows where price-to-value ratios are optimized. For instance, electronics typically see their lowest pricing in mid-November, while luxury food items peak in cost precisely 72 hours before Christmas Day.
"Effective holiday budgeting in high-cost environments like Vancouver isn't about spending less, but about timing the acquisition of assets to avoid peak demand surcharges."
The regional disparity in pricing is also notable. Surrey and Burnaby often show a 3-5% lower price point for bulk grocery items compared to Vancouver proper (the Downtown core and West End). This geographical arbitrage can provide significant savings for those willing to manage the transportation logistics effectively. Understanding these micro-trends is essential for maintaining a healthy debt-to-income ratio during the winter months.
The cost of a standard festive dinner in Vancouver has risen by 9.4% year-over-year. This increase is attributed to several factors including regional crop yields and processing labor costs.
Vancouver's entertainment sector operates on a dynamic pricing model. Major attractions such as the Bright Nights in Stanley Park or the Vancouver Christmas Market utilize tiered ticketing. Booking 30 days in advance typically secures a 20% discount compared to gate prices. Furthermore, mid-week attendance reduces costs and provides a better experience due to lower density.
Friday-Sunday evenings
$35 - $55 / person
Tuesday-Wednesday matinee
$18 - $28 / person
Logistics often represent the "hidden cost" of the holidays in Vancouver. Parking rates in the downtown core can surge to $30 per day during peak event windows. Additionally, the risk of winter weather events can lead to sudden spikes in ride-share pricing due to surge algorithms. For families traveling within the GVA (Greater Vancouver Area), TransLink remains the most cost-effective solution, though scheduling must account for seasonal holiday hours.

Infrastructure utilization is key to reducing seasonal transit overhead.
Initial capital assessment and budget cap setting. Establish a dedicated high-yield savings account for holiday liquidity.
Booking of high-demand event tickets and travel arrangements. This is the window for the lowest airline and VIA Rail pricing.
Execution of non-perishable grocery shopping and final gift procurement. Avoid the "Final 14" window where prices peak.
Download our full regional cost report or explore our analysis on high-yield savings to ensure your capital is working for you this winter.
Subscribe to be the first to know.